There is an interesting intersection between math, computer science, and art that has fascinated me for years, but I didn’t realize how strong the math and computer science components are until my studies at Stanford. The topic represents some of the most beautiful and mathematically sound forms of digital art and nature itself: fractals. I believe Wikipedia defines this concept best:
In mathematics, a fractal is an abstract object used to describe and simulate naturally occurring objects. Artificially created fractals commonly exhibit similar patterns at increasingly small scales. It is also known as expanding symmetry or evolving symmetry. If the replication is exactly the same at every scale, it is called a self-similar pattern. An example of this is the Menger sponge. Fractals can also be nearly the same at different levels. This latter pattern is illustrated in small magnifications of the Mandelbrot set. Fractals also include the idea of a detailed pattern that repeats itself.”
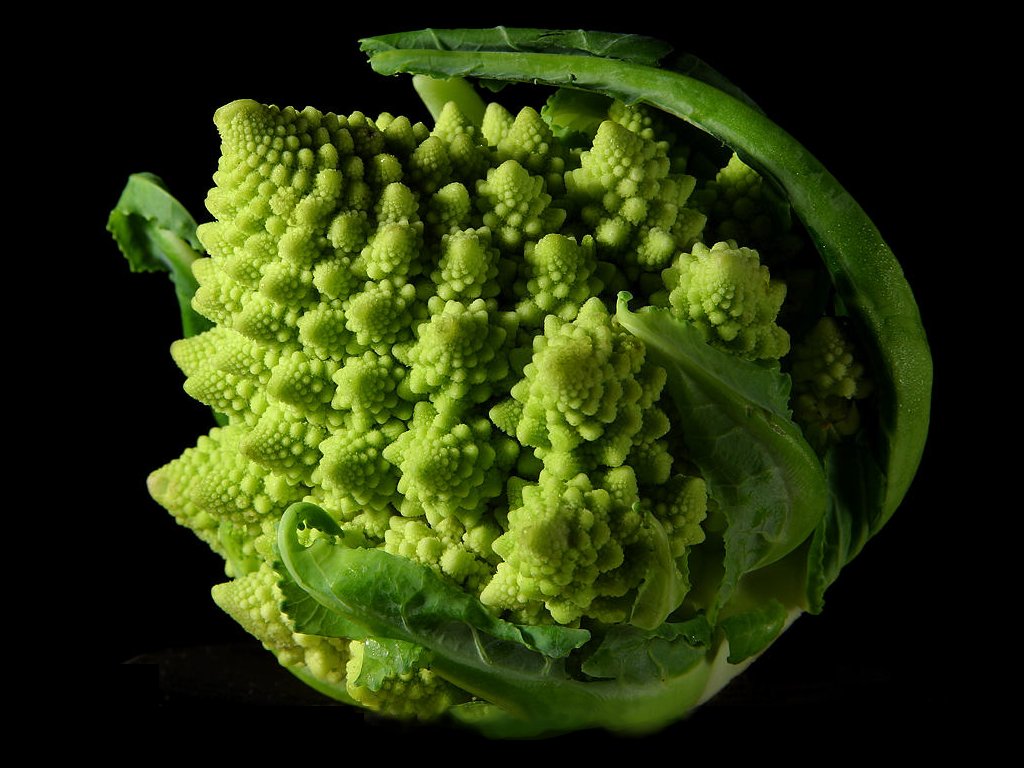
Fractals are not simply some mathematically-generated forms of digital art; they appear in nature as well. Romanesco broccoli, for example, is an edible form of a fractal, with self-similar meristems appearing on its bud. Frost crystals also naturally form fractal patterns on chilled glass.
By Jon Sullivan – http://pdphoto.org/PictureDetail.php?mat=pdef&pg=8232, Public Domain, https://commons.wikimedia.org/w/index.php?curid=95997

By Schnobby – Own work, CC BY-SA 3.0, https://commons.wikimedia.org/w/index.php?curid=19055302
To express my profound fascination with fractals and to introduce yet another platform for learning, we’ll see how to generate a popular fractal using HTML5, which I learned specifically to do this project. To build up the concept of fractals, I will first introduce a simple and classic example: the Cantor set.

By 127 “rect” – From en.wikipedia.org Image:Cantor_set_in_seven_iterations.svg, Public Domain, https://commons.wikimedia.org/w/index.php?curid=1576217
This fractal starts with a long, thin rectangle (shown at the top). We can consider this level 1 of the fractal. For each row that follows it, the repeating pattern works as follows: for each rectangle in the preceding row, remove the middle third of the rectangle. Thus level 2 takes the one rectangle in level 1 and removes its middle third section, resulting in the two rectangles shown in row 2. Level 3 takes the two rectangles shown in level 2 and removes the middle third of each, resulting in four rectangles. This pattern can repeat infinitely (but of course the computer resources are limited and our eyes can only see so many levels deep on a screen). This example shows 7 levels. The interesting thing is we can pick any single rectangle and look at only that portion of the fractal and still end up with a smaller but self-similar pattern that repeats just like the rest of the fractal, just on a different scale. Cool, huh?!
You’ve probably realized by now that this sounds like a recursive structure. We can write a function that has level 1 as the starting layer and then generates the other parts of the fractal recursively. Each level numbered x has 2^(x-1) rectangles. For a fractal with L levels, there are (2^L) – 1 total rectangles. Let’s look at my algorithm for generating this image:
1.  var canvas = document.querySelector('canvas');
2.  var context = canvas.getContext("2d");
3.  const barHeight = 30;
4. /* drawCantor: draws the cantor set for a given number of levels.
    * Parameters:
    * level = number of levels to generate
    * max_level = highest level; used to add the levels from top to bottom (stays constant)
    * x_start: the x coordinate of where to start drawing a rectangle
    * x_end: the x coordinate of where to stop drawing a rectangle
    */
5.  function drawCantor(level, max_level, x_start, x_end) {
6.    // only generate levels 1 - 13; hard to see levels beyond 13
7.    if (level < 1 || level > 13) return;

8.    // draw level
9.    context.beginPath();
10.   var y = barHeight/2 + (max_level - level) * barHeight * 2;
11.   context.moveTo(x_start, y);
12.   context.lineTo(x_end, y);
      // Use a different color per level by using a specific hue degree range:
13.   context.strokeStyle = "hsl(" + (360 - 120*level/max_level) + ",100%,30%)";
      context.stroke();
14.   context.closePath();

15.   drawCantor(level - 1, max_level, x_start,  x_start + (x_end - x_start)/3); // left
16.   drawCantor(level - 1, max_level, x_start + 2/3*(x_end - x_start), x_end);  // right
17. }

18. drawCantor(8, 8, 0, 1400);
Here is the result of this code (the actual code used has a resizing function to handle regenerating the image on browser resizing; I also added a scaling factor to generate high-quality images on retina displays):
Voila! We have a beautiful cantor set for 8 levels, and we’ve demonstrated the neverending elegance of recursion. :)
Sierpinksi triangle
Some other examples that I may code for you in the future (check back for updates!) include the Sierpinksi triangle and fractal trees. A Sierpinski triangle starts with an equilateral triangle, and then it is subdivided into four equally sized equilateral triangles. (Nerd quiz: what classic video game does this remind you of?!) Then the center triangle of the 4 is removed. This pattern is repeated with each of the remaining 3 smaller triangles.
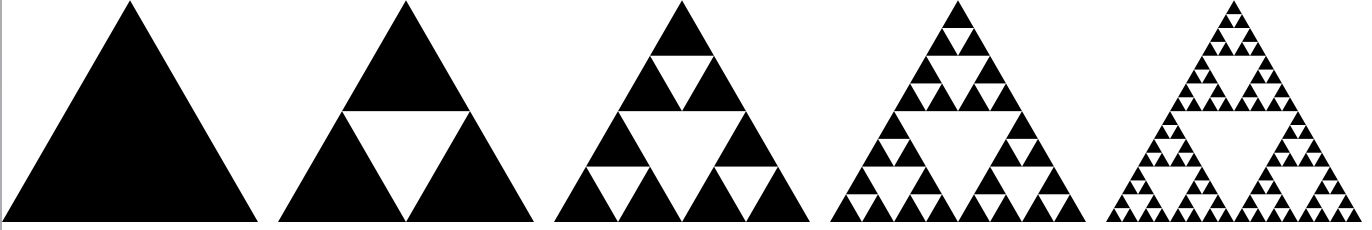
Generating a Sierpinksi triangle. By Wereon – Own work, Public Domain, https://commons.wikimedia.org/w/index.php?curid=1357937
Fractal trees start with a branch and then add repeating branches at different levels and angles. There’s no end to the number of beautiful fractal patterns out there. Do some research and see which ones you love best!
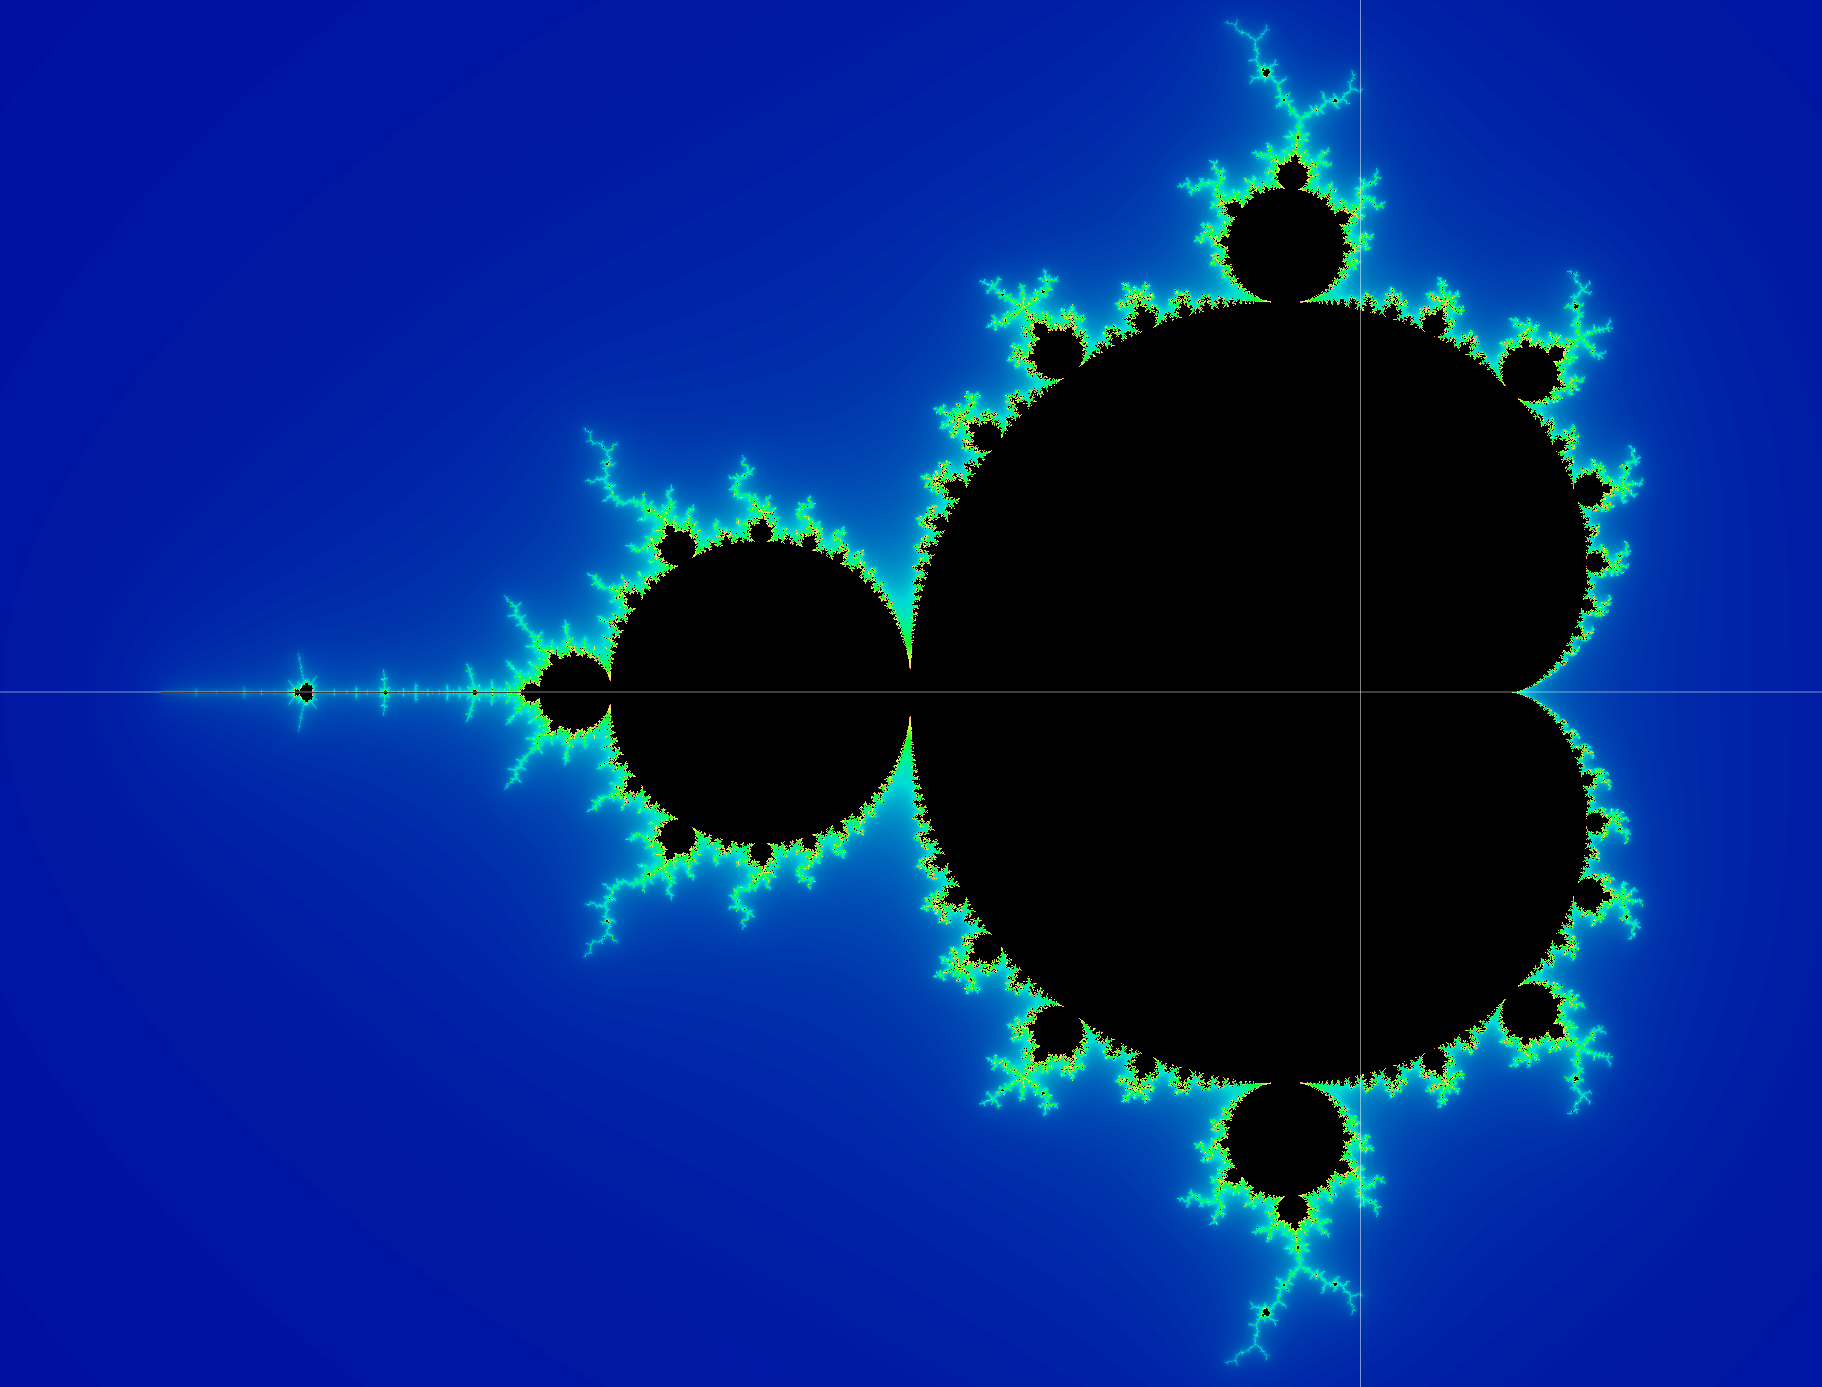
Now we’re ready to look at something a lot more visually interesting. A few weeks ago, a peer of mine introduced me to a nearly-similar fractal known as the Mandelbrot set, which is more complex than the examples we’ve explored so far. The idea is that there is an equation that determines whether a point on the XY-plane lies within the set of values that comprise the Mandelbrot set. If the point is in the set, color it black; otherwise, color it something else (we’ll actually use a gradient to color the points that aren’t members of the set).
Benoît Mandelbrot is a mathematician known for his in-depth study of a field that is said to be the father of: fractal geometry. He coined the term fractal, drawing inspiration from the Latin word fractus which means “fractured”. Mandelbrot once described fractals as “A fractal is a shape made of parts similar to the whole in some way.” The Mandelbrot set is named after him.
“The Mandelbrot set is a complication which includes a huge number of different fractals in its structure and is therefore beyond any fractal. It is a paradox of sorts that this has become the icon of fractality, whereas it does not fit the definition of the concept at all.” – Benoît Mandelbrot
To understand the way the Mandelbrot set works, we’ll need to go over some tricky math. The idea behind the algorithm is that for every point on the graph (at the scale that I’ve chosen in order to show this particular portion of the fractal), the algorithm generates a sequence of values that either remains bounded within some range (for example, the values in the sequence never go lower than -1 or higher than 1), which means it converges, or alternatively, it diverges. If it converges, then we say that point is in the set and we color it black on the canvas. If it diverges (tends towards infinity), then that point is not in the set and we give it a unique color. We can specify a certain number of iterations of this sequence to check for each point and use that as a threshold to determine whether that point gives a sequence that diverges. For divergence, there is some point in the sequence where we detect an “escape”: if an equation (expressed in terms of the coordinates x and y that comprise the point on the graph) is not less than some small enough value at the end of generating the sequence, then we can generate a color as a ratio of the iteration number in the sequence that resulted in divergence to the total number of iterations in the sequence.
This all probably sounds convoluted; it took a while for me to wrap my head around how this works. I won’t go into much detail about the math (which is described in detail here); the main algorithm that I use below is derived from the pseudocode at the bottom of the Wikipedia page). I also added a gradient color generator to color the points on the graph that are not in the set. Let’s look at the JavaScript to see how it works:
"use strict";

var canvas = document.querySelector('canvas');
var context = canvas.getContext("2d");

const pixelRatio = Math.round(window.devicePixelRatio) || 1; // used to render high res image on retina screens
var scaleFactor = 340 * pixelRatio;    // the canvas x or y value that corresponds to a 1 on the Mandelbrot plane

function fitToContainer() {
    canvas.style.width  = '100%';
    canvas.width        = canvas.offsetWidth * pixelRatio;
    canvas.style.height = Math.round((6/7) * canvas.width / pixelRatio) + 'px';
    canvas.height       = canvas.offsetHeight * pixelRatio;

    context.translate(canvas.width*0.75, canvas.height*kYscaleOrigin);
    scaleFactor = .36 * canvas.width;
    drawGraph();
}

const kYscaleOrigin = 0.5;  // origin for y axis is scaled
const kMaxIterations = 90;  // the "escape" threshold for a point

window.addEventListener('resize', fitToContainer);

function getColor(x_coord, y_coord) {
    var x_scaled = x_coord/scaleFactor;
    var y_scaled = y_coord/scaleFactor;
    var x = 0.0;
    var y = 0.0;
    var iteration = 0;
    // use a math trick (source: Mandelbrot Wiki page) to avoid imaginary/complex numbers:
    while (x*x + y*y < 256 && iteration < kMaxIterations) {
        var xtemp = x*x - y*y + x_scaled;
        y = 2*x*y + y_scaled;
        x = xtemp;
        iteration++;
    }

    if (x*x + y*y < 4) return "hsl(0,0%,0%)"; // black in point is in Mandelbrot set

    // otherwise, smooth color to get gradient step sizes for colors:
    if (iteration < kMaxIterations) {
        var log_zn = Math.log( x*x + y*y ) / 2;
        var nu = Math.log( log_zn / Math.log(2) ) / Math.log(2);
        iteration += 1 - nu;
    }

    var fraction = iteration/kMaxIterations;
    var hue = 240 - 240 * fraction;
    var sat = 100;
    var light = 30 + 50*fraction;

    return "hsl(" + hue + "," + sat + "%," + light + "%)";
}

// Draw coordinate plane and the Mandelbrot graph
function drawGraph() {
    // Set-up canvas coordinate plane
    const mostNegCanvasXvalue = -canvas.width*0.75;
    const mostPosCanvasXvalue = 0.25*canvas.width;
    const mostPosCanvasYvalue = kYscaleOrigin*canvas.height;
    const mostNegCanvasYvalue = -mostPosCanvasYvalue;

    for(var x_coord = mostNegCanvasXvalue; x_coord <= mostPosCanvasXvalue; x_coord++) {
        for(var y_coord = mostNegCanvasYvalue; y_coord <= mostPosCanvasYvalue; y_coord++) {
            context.fillStyle = getColor(x_coord, y_coord);
            context.fillRect(x_coord, y_coord, 1, 1);
        }
    }

    drawAxes();
}

function drawAxes() {
    context.beginPath();
    context.moveTo(0, canvas.height);
    context.lineTo(0, -1*canvas.height);
    context.moveTo(canvas.width, 0);
    context.lineTo(canvas.width*-1, 0);
    context.strokeStyle = "#FFF";
    context.lineWidth = 0.5;
    context.stroke();
}
Here is the result (generating this takes a few seconds because the image is high-resolution and has a lot of colors):
This image is very close to the main image used to illustrate the Mandelbrot set on the Wiki page. Once a point "escapes" the set, it gets a color that is determined by how close it is to a black point that is in the set. Closer points range from yellow to green; points that are farther away range from light to dark blue. If you look closely, you can see the parts of the image that look like the main black "continent". My favorite part is actually the smaller version of the continent shown towards the left along the x-axis. In addition, the black circles that surround the big kidney-bean shape are also self-similar although at different scales.
I had fun generating these fractals and got to mess around with the HTML5 canvas for the first time. I can't wait to discover and code more fractals!